The methods you need.
Advanced. Adaptive. Accessible.
TRACK CHANGES is a platform for advanced longitudinal data analysis. Each module is a specialized statistical engine built to answer a different class of question about how people change over time — from the coupling dynamics between two constructs, to the architecture of full psychological systems, to the moment-by-moment signals buried in intensive data, to the pathways people travel between discrete states. Click a module below to learn more.
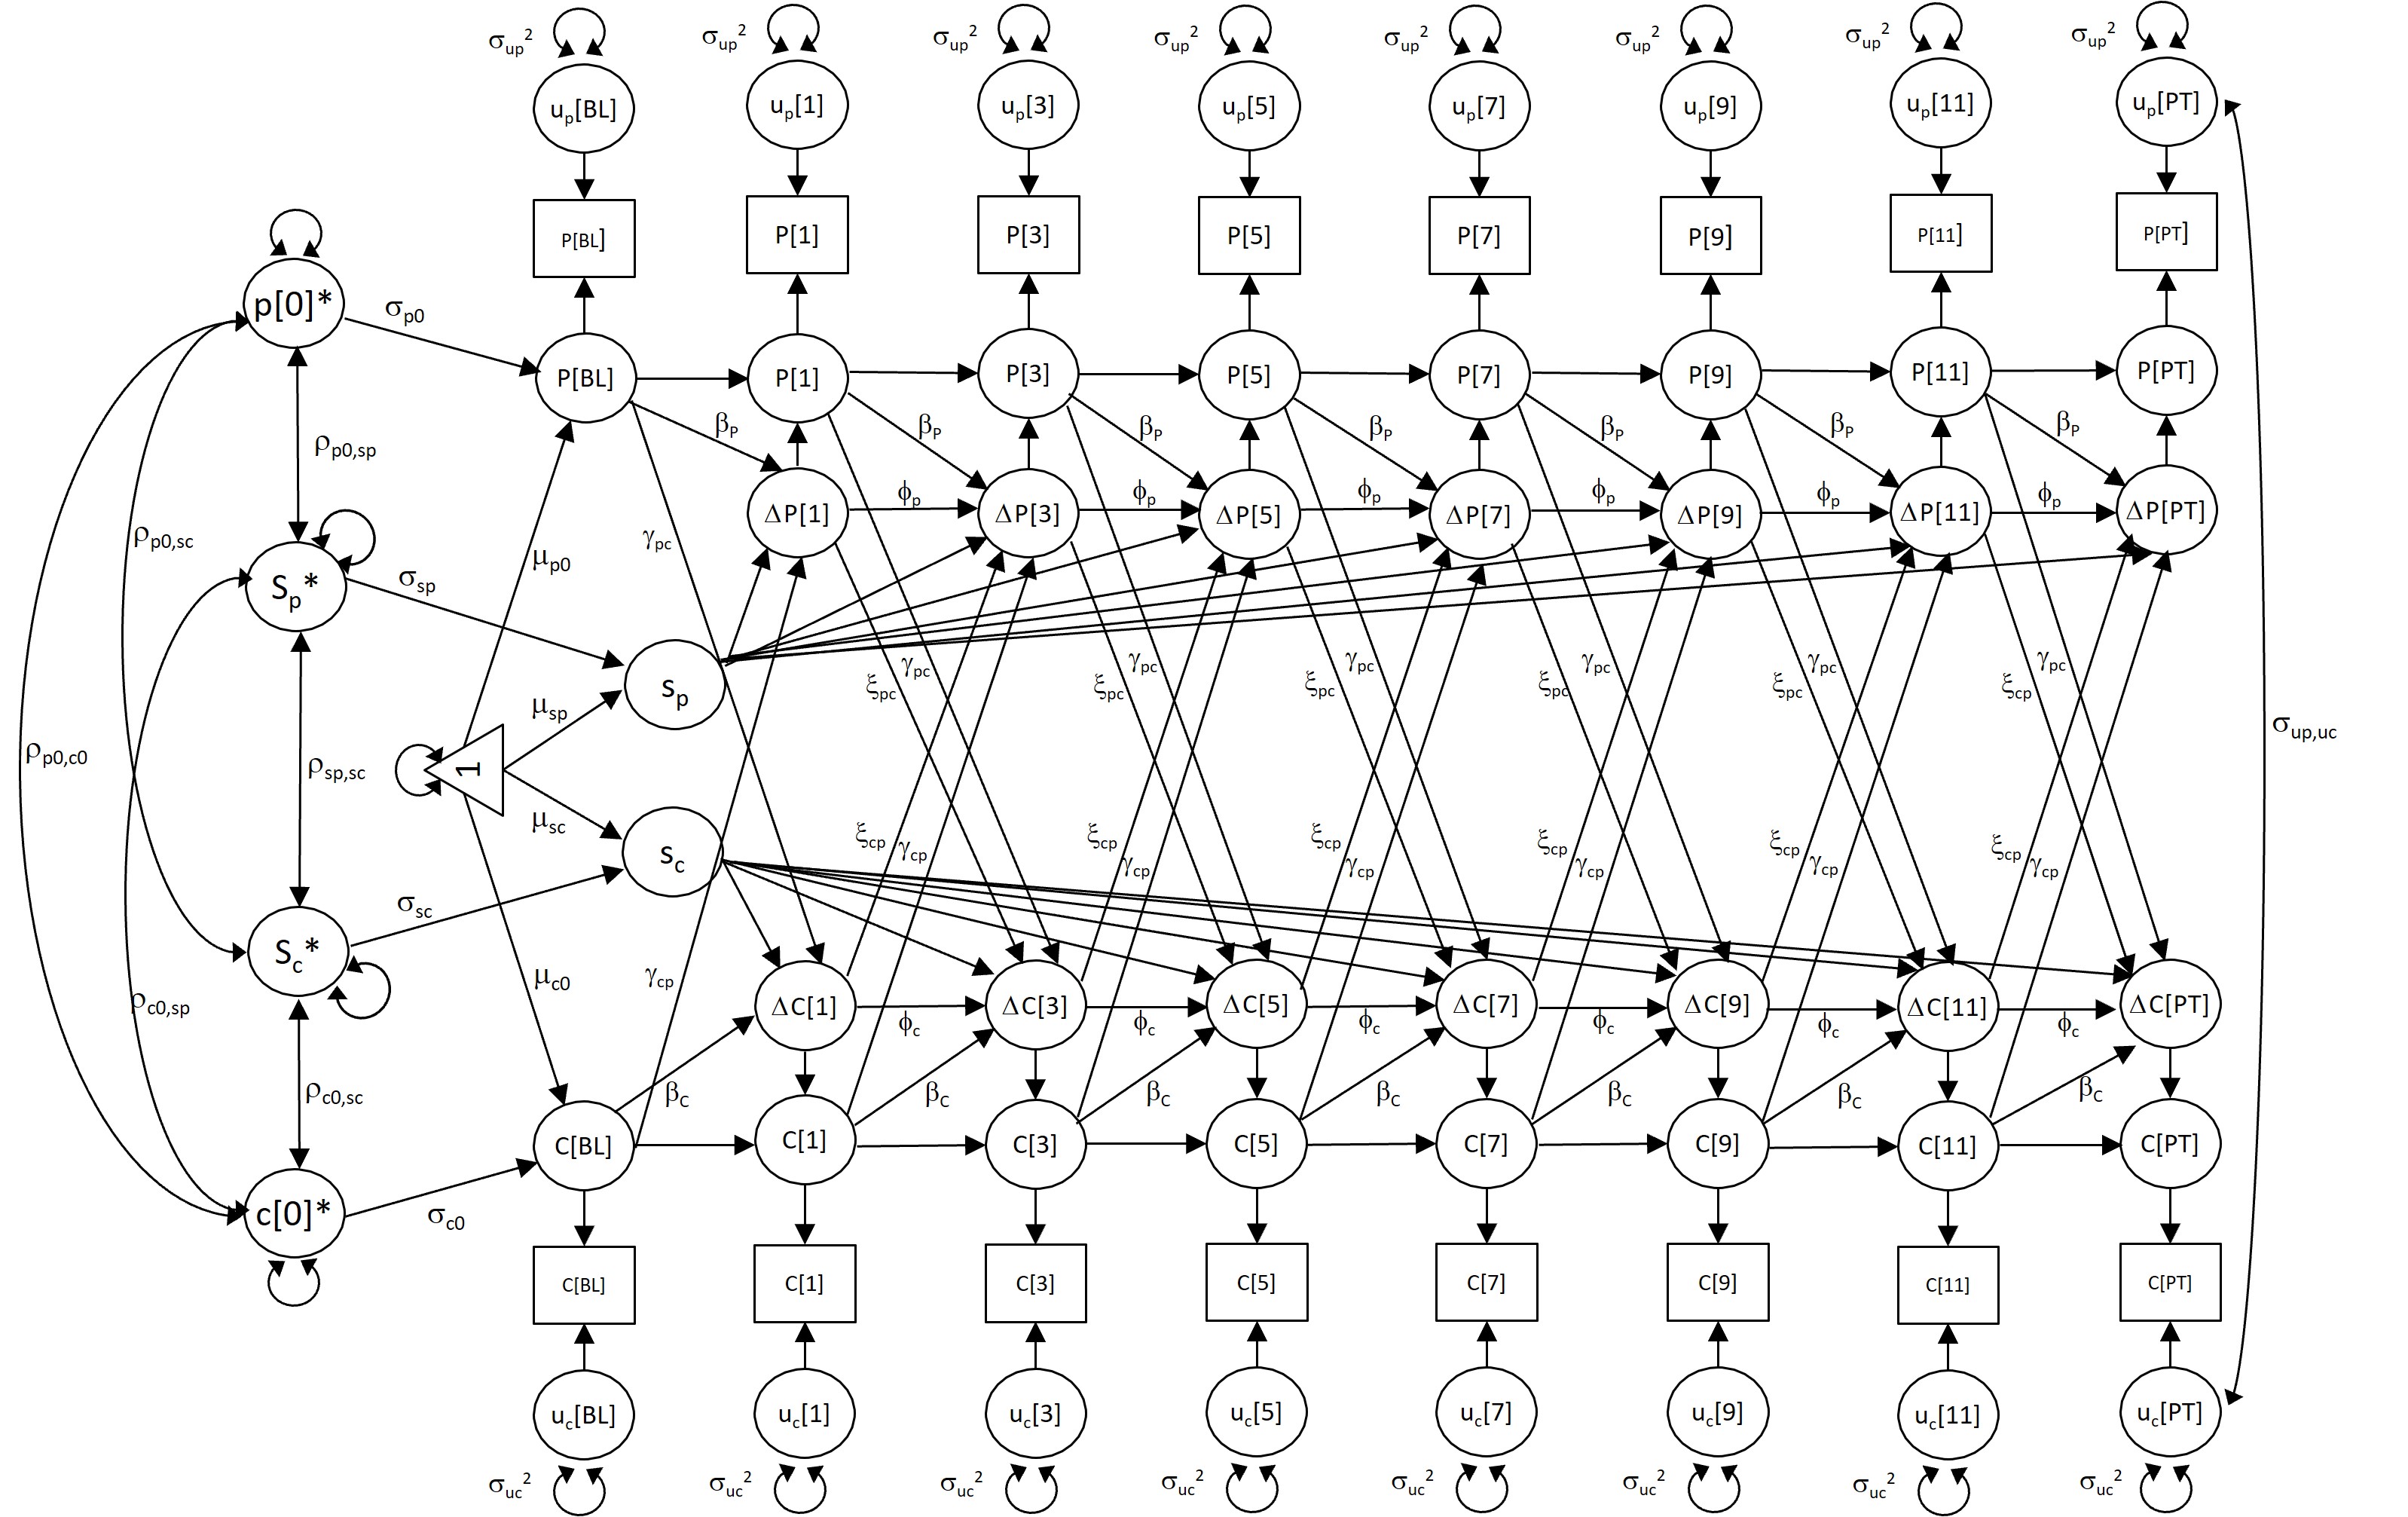
Bivariate Dual Latent Change Score modeling — two constructs, full coupling architecture
Models the reciprocal dynamic relationship between two constructs across time. Estimates whether changing on one construct drives changing on the other, whether symptom severity acts as a brake on recovery in the paired domain, and whether therapeutic momentum transfers across constructs.
These modules are designed to be used together.
Each one answers a different question about the same data — and the questions compound.
Use MOMENTS to find the session where the system destabilized before your patient improved. Use BRIDGES to identify what drove that improvement — and in which direction.
Use CHORDS to estimate the continuous coupling architecture of your construct network. Use STREAMS to characterize the discrete pathway types — Chronic, Sudden Gainer, Fragile Improver — that the continuous model averages over.
Use STREAMS to identify which participants were on a recovery trajectory and which were chronic. Use BRIDGES within each group to see if the coupling dynamics differ.
Use MOMENTS to detect when a critical transition occurred in intensive data. Use STREAMS to classify whether that transition reflected a stable state change or a temporary fluctuation.
The methods are different. The platform is the same. The output speaks the same language. That’s the point.
One platform. One standard.
Every TRACK CHANGES module shares the same architecture — because rigor shouldn’t depend on which question you’re asking. Upload your data once. Receive a complete, publication-ready report every time. The same infrastructure applies whether you’re modeling coupling dynamics between two constructs or tracking state transitions across a full longitudinal panel.
Exact results. Every time.
TRACK CHANGES was independently validated against expert hand-coded Mplus syntax. Identical parameter estimates, fit statistics, nested model tests, and model selection outcomes across both the univariate and bivariate testing ladders.
The two-level interpretive framework implemented in BRIDGES is described in Hale (forthcoming), building on the B-DLCS foundations established by McArdle & Hamagami (2001) and the four-parameter specification in Grimm (2012).
No license. No install. Just science.
TRACK CHANGES runs in any modern browser. The back-end relies exclusively on open-source R packages. Full lavaan and Mplus syntax exported for every model — complete transparency, no black-boxing.
Your data. Your constructs. Your answer.
Stop asking questions you can't answer. TRACK CHANGES gives you the model, the interpretation, and the output — free, in your browser, in under a minute.